Welcome to Incels.is - Involuntary Celibate Forum

Welcome! This is a forum for involuntary celibates: people who lack a significant other. Are you lonely and wish you had someone in your life? You're not alone! Join our forum and talk to people just like you.

The most blackpilled countries have the highest IQs

Enigmatic93

Enigmatic93

Banned
-
Joined
Nov 7, 2017
Posts
1,448
Countries like China, Japan, Korea are known for men adopting the LDAR lifestyle but also for practically everyone getting plastic surgery.

https://iq-research.info/en/page/average-iq-by-country
 
1697037722378

1697037728446

1697037733442

...

World IQ Map:

1104px-World-iq-map-lynn-2002.svg.png


RankCountry/RegionIQØ IncomeEducation expenditure
per inhabitant
Ø Daily maximum
temperature
1Hong Kong *10635,304 $1,283 $26.2 °C
2Japan10640,964 $1,340 $19.2 °C
3Singapore10641,100 $1,428 $31.5 °C
4Taiwan *10626.9 °C
5China1044,654 $183 $19.1 °C
6South Korea10322,805 $1,024 $18.2 °C
7Netherlands10145,337 $2,386 $14.4 °C
8Finland10142,706 $2,725 $8.2 °C
9Canada10040,207 $2,052 $7.4 °C
10North Korea10015.3 °C
11Luxembourg10071,296 $3,665 $14.7 °C
12Macao *10044,072 $1,448 $26.0 °C
13Germany10039,911 $1,883 $13.8 °C
14Switzerland10070,399 $3,550 $15.2 °C
15Estonia10013,770 $749 $10.1 °C
 
Last edited:
1697719862574


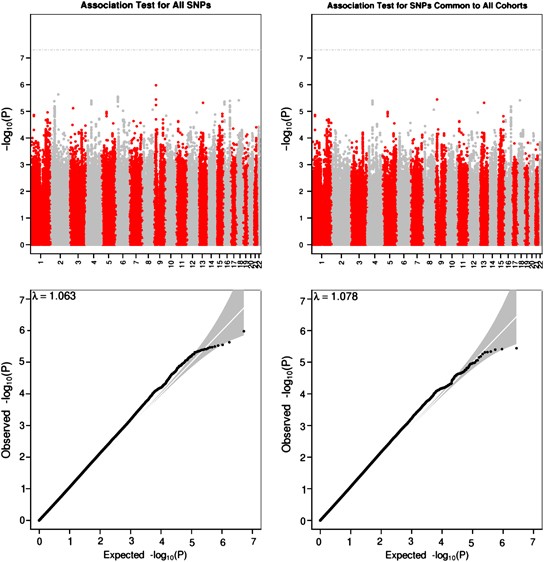
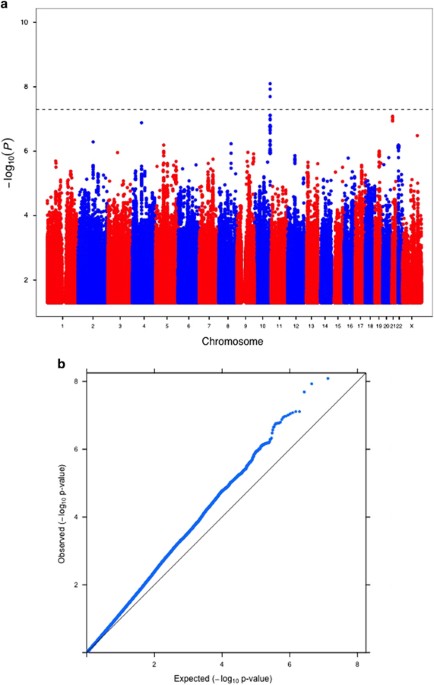
Intelligence in childhood, as measured by psychometric cognitive tests, is a strong predictor of many important life outcomes, including educational attainment, income, health and lifespan. Results from twin, family and adoption studies are consistent with general intelligence being highly heritable and genetically stable throughout the life course. No robustly associated genetic loci or variants for childhood intelligence have been reported. Here, we report the first genome-wide association study (GWAS) on childhood intelligence (age range 6–18 years) from 17 989 individuals in six discovery and three replication samples. Although no individual single-nucleotide polymorphisms (SNPs) were detected with genome-wide significance, we show that the aggregate effects of common SNPs explain 22–46% of phenotypic variation in childhood intelligence in the three largest cohorts (P=3.9 × 10⁻¹⁵, 0.014 and 0.028). FNBP1L, previously reported to be the most significantly associated gene for adult intelligence, was also significantly associated with childhood intelligence (P=0.003). Polygenic prediction analyses resulted in a significant correlation between predictor and outcome in all replication cohorts. The proportion of childhood intelligence explained by the predictor reached 1.2% (P=6 × 10⁻⁵), 3.5% (P=10−3) and 0.5% (P=6 × 10⁻⁵) in three independent validation cohorts. Given the sample sizes, these genetic prediction results are consistent with expectations if the genetic architecture of childhood intelligence is like that of body mass index or height. Our study provides molecular support for the heritability and polygenic nature of childhood intelligence. Larger sample sizes will be required to detect individual variants with genome-wide significance.


1697719910869

1697719919291

1697719924900

1697719931732
 
Intelligence in human populations is associated with a wide range of important life outcomes, including educational attainment, income, health and longevity, and intelligence in childhood is a predictor of those outcomes.1 Twin, family and adoption studies have shown that intelligence, as measured using validated psychometric cognitive tests (Intelligence Quotient (IQ)-type tests), is one of the most heritable behavioural traits.2 These findings have been consistently replicated, but the molecular basis of intelligence remains poorly understood. The supporting evidence from the molecular findings has not been consistent and many reported candidate–gene associations have not been replicated.2 A recent study suggested that most reported associations between candidate genes and intelligence are likely to be false.3

The recent successes of genome-wide association studies (GWAS) for many complex traits, where > 1200 genetic variants have been associated with complex traits,4 have not been achieved for behavioural traits, including intelligence.58 The most plausible reason for this failure is that the effect size of individual genetic variants is so small that the current experimental sample sizes are not large enough for detection.9,10 For example, using ∼3500 individuals, Davies et al.6 did not find any genome-wide significant single-nucleotide polymorphism (SNPs) associated with intelligence in adults. However, when the combined effects of SNPs were analysed simultaneously, they found that common SNPs accounted for 40–51% of the variation for different measures of intelligence.

Individual sample quality control

Within each cohort, individuals were removed based on missingness, heterozygosity, relatedness, population and ethnic outliers, and other cohort-specific quality control (QC) steps. There were variations of QC between participating studies as the exact choice of QC thresholds depends on genotyping platform and study. More details on the QCs for each cohort are described in the Supplementary Note.

SNP QC

For the meta-analysis, SNPs were removed based on missingness (call rate <95%), minor allele frequency (<1%), Hardy–Weinberg (P-value <10−6), Mendelian errors (if family data were available) and other QC, such as the mean of GenCall score for Illumina arrays. As part of the QC procedure, we also calculated the average effective sample size (N) per cohort as a function of the allele frequency (p) and the standard error of the effect size (se) from the association test as N=1m∑i=1m1(2p(1−p)se2Rsq)′ where m is the number of SNPs and Rsq is the imputation quality score. This formula was derived from linear regression theory (Supplementary Note). This calculated N is a useful measure to check for the consistency of the reported sample size and the actual sample size that was used in the association analysis. We found that the calculated Ns were consistent with the reported Ns in all cohorts (Supplementary Table 1). We also checked for the consistency of the SNP allele frequencies between cohorts (Supplementary Figures 1 and 2).

Statistical analyses


Imputation

To facilitate the meta-analysis, the imputation of unobserved genotypes from the HAPMAP II CEU Panel (Release 22, NCBI Build36, dbSNP b126) was conducted within each cohort. This imputation was conducted on QC-ed data using the positive strand as the reference. We conducted the imputation using either BEAGLE,14 IMPUTE15 or MACH.16 We excluded imputed SNPs when the quality score (IMPUTE) or Rsq (MACH) was <0.3.

Association analysis

The association analysis was performed separately within each cohort. Except for the family data from QIMR, the analysis used the dosage score (the estimated counts of the reference allele in each individual; these estimates could be fractional and ranged from 0.0 to 2.0). An additive model was used on the standardised residuals (Z-score, transformed to normality if the phenotype is highly skewed) of the trait after adjusting for known covariates (age, sex, cohort, etc., including subtle population stratification effects, that is, the first four multi-dimensional scaling or PC (principal component) scores for each individual from a stratification analysis) on both genotyped and imputed SNPs. Both the directly genotyped and imputed SNPs were aligned to the HapMap reference strand. The Manhattan and Q–Q plots of the association P-values for each discovery cohort are presented in Supplementary Figures 3 and 4.

Meta-analysis

The results for associations between SNPs and childhood intelligence from the discovery samples were meta-analysed in the Metal package.17 We weighted the effect size estimates using the inverse of the corresponding squared standard errors. We also assessed the heterogeneity between the estimates in all cohorts using Cochran's Q statistic. The meta-analysis was performed for 2611179 SNPs. To avoid a disproportionate contribution of a single cohort to the results, we selected the association results for SNPs that survived QC in all cohorts (Total SNPs: 138093). The meta-analysis results from SNPs that survived QC in all cohorts were used for subsequent analyses, that is, gene-based analysis and profile scoring for the genetic prediction analysis. The detailed plot of the most significantly associated SNP in the meta-analysis is presented in Supplementary Figure 5.

Gene-based analysis

By considering all SNPs within a gene as a unit for the association analysis, a gene-based analysis can be a powerful complement to the single SNP–trait association analysis.18 We performed this gene-based analysis in Vegas software (Queensland Institute of Medical Research, Brisbane, Australia)18 using the P-values of the association between SNPs and childhood intelligence generated from the meta-analysis. We also conducted this gene-based analysis in each of the replication cohorts. Since there are ∼17000 genes, the genome-wide P-value threshold for declaring statistical significance following the Bonferroni correction for multiple testing was 0.05/17 000 = 3 × 10⁻⁶. Given the overlap between genes, the actual number of independent genes tested is likely to be smaller. Therefore, the Bonferroni correction for gene-based analysis is likely to be conservative.18 A detailed plot of the most significant gene from this gene-based analysis, FNBP1L, is presented in Supplementary Figure 6.

GCTA analysis

We estimated the contribution of all common SNPs on childhood intelligence by performing a linear mixed-model analysis to fit all genotyped SNPs simultaneously in the model, as implemented in the GCTA program.9 We excluded close relatives in the analysis by removing an individual from a pair where the estimated genetic coefficient of relatedness was > 0.025. One of the reasons for this exclusion is to eliminate bias due to common environmental factors. We conducted this analysis in the three largest cohorts, that is, ALSPAC, TEDS and UMN. The numbers of individuals used for this analysis were 5517, 2794 and 1736 children in the ALSPAC, TEDS and UMN cohorts, respectively.

Genetic prediction analysis

We used the estimates of SNP effect size from the meta-analysis to build a multi-SNP prediction model. We used this model to estimate the proportion of the phenotypic variation in independent samples that is due to genotypic information alone. To do this, we first identified independent SNPs from the meta-analysis using a P-value informed linkage disequilibrium (LD) clumping approach in PLINK19 with a cutoff of pairwise R2≤0.25 within a 200-KB window.20 Using this approach, we identified all independent SNPs that are significant at various P-value thresholds (Pt) (that is, 0.001, 0.005, 0.01, 0.05, 0.10, 0.25, 0.5 and 1). From groups of SNPs at each Pt threshold, we then calculated a quantitative genetic score19 or multi-SNP predictors in each of the three independent samples, that is, Generation R, NTR and UMN. We then performed a linear regression analysis between the quantitative genetic score and the observed measure of childhood intelligence, and quantified the precision of the predictor as the R2 measure of variance explained in the phenotype by the predictor.

...

No.
 
Last edited:
1697720622625


The single-nucleotide polymorphism heritability for the extreme IQ trait was 0.33 (0.02), which is the highest so far for a cognitive phenotype, and significant genome-wide genetic correlations of 0.78 were observed with educational attainment and 0.86 with population IQ. Three variants in locus ADAM12 achieved genome-wide significance, although they did not replicate with published GWA analyses of normal-range IQ or educational attainment. A genome-wide polygenic score constructed from the GWA results accounted for 1.6% of the variance of intelligence in the normal range in an unselected sample of 3414 individuals, which is comparable to the variance explained by GWA studies of intelligence with substantially larger sample sizes. The gene family plexins, members of which are mutated in several monogenic neurodevelopmental disorders, was significantly enriched for associations with high IQ. This study shows the utility of extreme trait selection for genetic study of intelligence and suggests that extremely high intelligence is continuous genetically with normal-range intelligence in the population.

Although the small effect size of individual DNA variants detracts from their utility in neurocognitive research, polygenic scores can be created that aggregate the effects of DNA variants to predict genetic propensities for individuals.6, 7 For example, the current strongest polygenic score prediction of a quantitative trait is for height, which predicts nearly 20% of the variance of height in independent samples.8https://www.nature.com/articles/mp2017121#ref-CR8

We conducted a case–control GWA analysis with cases consisting of 1238 individuals from the top 0.0003 (mean IQ score~170) of the population distribution of intelligence
 
Larger sample sizes will be required to detect individual variants with genome-wide significance

...


1697721420182


Here we conducted a large-scale genetic association analysis of educational attainment in a sample of approximately 1.1 million individuals and identify 1,271 independent genome-wide-significant SNPs. For the SNPs taken together, we found evidence of heterogeneous effects across environments. The SNPs implicate genes involved in brain-development processes and neuron-to-neuron communication. In a separate analysis of the X chromosome, we identify 10 independent genome-wide-significant SNPs and estimate a SNP heritability of around 0.3% in both men and women, consistent with partial dosage compensation. A joint (multi-phenotype) analysis of educational attainment and three related cognitive phenotypes generates polygenic scores that explain 11–13% of the variance in educational attainment and 7–10% of the variance in cognitive performance. This prediction accuracy substantially increases the utility of polygenic scores as tools in research.
 

Similar threads

AsiaCel
Replies
27
Views
403
StonePath
StonePath
AsiaCel
Replies
27
Views
696
Skoga
Skoga
highschoolcel
Replies
16
Views
465
Blackpill Monk
Blackpill Monk

Users who are viewing this thread

shape1
shape2
shape3
shape4
shape5
shape6
Back
Top