Welcome to Incels.is - Involuntary Celibate Forum

Welcome! This is a forum for involuntary celibates: people who lack a significant other. Are you lonely and wish you had someone in your life? You're not alone! Join our forum and talk to people just like you.

Blackpill (2025 Spanish study) Women are a third of people reporting ever drugging and raping someone at a party

  • Thread starter The Notorious SLAV
  • Start date
The Notorious SLAV

The Notorious SLAV

Foid Oppression Denial Division Commander
★★★★★
Joined
Oct 30, 2022
Posts
21,644
Online time
3d 8h
Always love to see yet another hole in the "women-are-wonderful" wall being made:feelshmm:. The difference between Spanish and foreigners/mixed ancestry(?) people being even bigger than between the sexes is also interesting, and implies that minority and foreign women are doing so more than Spanish guys.

Mzntbrrfv


Also, the ratio being so similar to that in the DFSA study which included gang rapes is likewise pretty interesting; and further implies that, while women might do so less often, when they do so, they might be as often doing it in groups, percentage-wise, as men do.

 
what about the other two thirds...
 
Always love to see yet another hole in the "women-are-wonderful" wall being made:feelshmm:. The difference between Spanish and foreigners/mixed ancestry(?) people being even bigger than between the sexes is also interesting, and implies that minority and foreign women are doing so more than Spanish guys.

View attachment 1740413


Also, the ratio being so similar to that in the DFSA study which included gang rapes is likewise pretty interesting; and further implies that, while women might do so less often, when they do so, they might be as often doing it in groups, percentage-wise, as men do.

Yet Spanish women host massive feminists protest denouncing their own men. And at the same time they protested and pleaded to give millions of illegal immigrants and foreign refugees anmesty/citizenship.
 
do you have a doi link for this study by chance?
 
Spain is doomed.
 
Doing drugs is a sign of low iq and low impulse control. I will never do drugs
 
dude I have to go eat dinner now so I'll reply in about 1-2 hours with the full analysis but holy shit this might be one of the worst fucking papers I've ever seen and the fact that it was funded by a European Union commission is very telling.
 
dude I have to go eat dinner now so I'll reply in about 1-2 hours with the full analysis but holy shit this might be one of the worst fucking papers I've ever seen and the fact that it was funded by a European Union commission is very telling.
Noted:feelsokman:.
 
Just because this is related to Spain and I live there, I want to say that this fucking country is one of the biggest feminist shitholes in all of the world, I would go as far as to say that it beats out the nordics
The indoctrination is extremely brutal, education has feminist stuff stuck into the heads of boys constantly and the media is unironically non/stop 24-7 spew of the new sexist killing or whatever, and this study will probably be buried because of that
And yet the media still cries out about how sexist the country is or whatever
 
Just because this is related to Spain and I live there, I want to say that this fucking country is one of the biggest feminist shitholes in all of the world, I would go as far as to say that it beats out the nordics
The indoctrination is extremely brutal, education has feminist stuff stuck into the heads of boys constantly and the media is unironically non/stop 24-7 spew of the new sexist killing or whatever, and this study will probably be buried because of that
And yet the media still cries out about how sexist the country is or whatever
same as italy
 
Always love to see yet another hole in the "women-are-wonderful" wall being made:feelshmm:. The difference between Spanish and foreigners/mixed ancestry(?) people being even bigger than between the sexes is also interesting, and implies that minority and foreign women are doing so more than Spanish guys.

View attachment 1740413


Also, the ratio being so similar to that in the DFSA study which included gang rapes is likewise pretty interesting; and further implies that, while women might do so less often, when they do so, they might be as often doing it in groups, percentage-wise, as men do.

This is one of the worst papers I have ever read in terms of methodology. Honestly abhorrent.

1) Insanely low sample size.
1600 people to represent the whole segment of 18-35 is nuts. Any generalization is extremely risky, without even considering the rest of the paper, just on this notion alone. (I will explain why they ran this shit on 1600 people at the end of the comment, be prepared because it will make you cry due to the sheer amounts of cringe and disgust for the profession of "social sciences researcher").


2) Selection bias.
Participants were recruited from an online panel managed by a research company certified under ISO 20252, which provides verified samples for social and health research. The panel includes more than 100,000 registered members residing in Spain. Panelists are recruited through paid social strategies and undergo a validation process, with sociodemographic profiles periodically updated to ensure data accuracy.
acknowledged by the researchers:
Second, although quota sampling approximated the demographic distribution of the Spanish population in terms of age, gender, and region, participation was voluntary and based on an online panel, which may have introduced self-selection bias and limited generalizability
It definitely introduced selection bias. 100k registered members who get on those platforms solely for the incentives (money, gift cards) and realistically only care about optimization of revenue.
Justified as follows:
As a result of their participation in the surveys, panelists receive incentive points that can be redeemed through a catalog of gifts, prize draws, and even donations to nongovernmental organizations. These incentives are flexible and tailored to the specific conditions of each survey, taking into account factors such as survey duration, and are designed to reward panelists according to their level of commitment and effort. The incentive system allows for variations to be defined according to the survey process, ensuring that panelists receive appropriate compensation for their time and contributions. This approach not only motivates panelists to participate actively in surveys but also encourages them to provide thoughtful and comprehensive responses, resulting in higher-quality data by optimizing participant engagement and maximizing response rates.
Detached from reality.

3) Social desirability bias.
Questions were designed to avoid identifiable information and social desirability biases.
acknowledged by the researchers:
Social desirability bias cannot be entirely ruled out despite assurances of anonymity.
Why? Because if you're asking people "hey have you committed this morally depraved and illegal act? we aren't collecting any info, source: trust me bro" you will always get downplayed results. Always. Both on the victim and perpetrator parts.

Ethics approval was granted by the Research Ethics Committee of the University of Alcalá (approval code CEIP2022/2/040) on March 31, 2022. Informed consent was obtained from all participants before taking part. Participation was voluntary, and participants were free to decline or withdraw at any time. Privacy and confidentiality were ensured through the use of an anonymous survey. No personal identifiers were collected, and all data were analyzed in aggregate form. Consequently, individual participants cannot be identified from the dataset.
Not naming the provider of anonymous surveys = no guarantee that it was actually anonymous.

Here is the appended questionnaire:
Appendix 1: Questionnaire (English Translation)

The questionnaire used was more extensive. Only the set of questions that generated the variables used for this study is shown.

Participation Note: Participation is completely voluntary and anonymous. All shared data are subject to the Spanish Organic Law 3/2018, of December 5, on Personal Data Protection and Guarantee of Digital Rights. We guarantee the absolute anonymity and confidentiality of your responses, in strict compliance with the laws on statistical secrecy and personal data protection.

It is very important that you answer honestly. Please remember that everything you say is completely confidential. Once the information is recorded anonymously, individual questionnaires are destroyed.

Some questions address intimate aspects of sexual life and experiences, so we thank you in advance for your honest answers. Thank you for participating in our survey.​

Do you agree to participate in this survey?

  • Yes
  • No
Next, we will ask you about your sexual experiences in the past. It is very important that you answer honestly. Everything you say is completely anonymous and confidential.

Have you ever in your life, while partying or immediately after, experienced any of the following episodes without your consent while under the influence of alcohol or other drugs?


Behavior
Yes
No
Prefer not to answer
Kissing​
Touching​
Masturbation​
Oral sex (fellatio, cunnilingus)​
Vaginal penetration​
Anal penetration​
Do you think that, at any time while partying or immediately after, you have engaged in any of these behaviors toward someone who was under the influence of alcohol or other substances and could not communicate their sexual consent?

Behavior
Yes
No
Prefer not to answer
Kissing​
Touching​
Masturbation​
Oral sex (fellatio, cunnilingus)​
Vaginal penetration​
Anal penetration​


Indicate your sex as it appears on your ID card, passport, or a similar official document:

  • Male
  • Female
  • Prefer not to answer
How old were you on your last birthday? Enter your age in digits:

From the following list, which option best describes your sexual orientation?
By sexual orientation, we mean which sex you are attracted to.

  • Heterosexual (people of the opposite sex)
  • Homosexual (people of your same sex)
  • Bisexual (people of both sexes)
  • Other sexual orientation
  • I haven’t decided yet / I don’t know
  • Prefer not to answer
How often do you watch pornography? By watching pornography, we mean intentionally searching for and viewing videos or photographs with explicit sexual content.

  • Every day or almost every day (4 times or more per week)
  • 2 or 3 times per week
  • Once a week
  • 2 or 3 times per month
  • Less than once a month
  • I never watch pornography
  • Prefer not to answer
When you watch pornography, on a scale from 1 to 10, where 1 is never and 10 is always, how often do you see scenes in which a person is asleep, unconscious, or under the influence of drugs (sedation or other effects)?

When discussing politics, the terms left and right are commonly used. On a scale from 1 to 10, where 1 means "far left" and 10 means "far right," where would you place yourself on this scale?


Regarding nationality, your nationality is:


  • Spanish
  • Spanish and another nationality
  • Another nationality
  • Prefer not to answer
Currently, among all the members of your household living with you, including yourself, approximately, what is your total monthly net income?

  • No monthly income
  • Less than or equal to €1,000
  • Between €1,001 and €2,000
  • Between €2,001 and €3,000
  • Between €3,001 and €4,000
  • More than €4,000
  • I don’t know
  • Prefer not to answer
What is the highest level of education you have completed?

  1. Less than primary education
  2. Primary education
  3. Secondary education
  4. Basic vocational training
  5. Intermediate vocational training
  6. High school / Baccalaureate
  7. Higher vocational training
  8. University studies (Bachelor’s degree, Licentiate, etc.)
  9. Postgraduate studies (Master’s, Postgraduate, Doctorate, etc.)
  10. Prefer not to answer
The questionnaire has non-trivial issues:
1) Overlooking consumption of alcohol and drugs during parties. This is a major point that completely fucks up the statistical analysis, touched upon later;
2) Flattening a 1-10 spectrum of political opinions into a dichotomy (presumably 1-5 Left, 6-10 Right);
3) Flattening a 1-10 spectrum of such pornographic content as the above mentions, into a dichotomy (presumably 1 No, 2-10 Yes), which is is in extreme bad faith;
4) Not including female rapist's vagina/anus being forcefully penetrated with a male's penis (worded extremely poorly because I am retarded, it's the usual issue of rape laws being incomplete);
5) Not including certified diagnoses of psycho-pathologies such as ASPD, Psychopathy, Sociopathy etc. (which would be dubious unless rigidly certified through methods that would disrupt the anonymity of the respondents, rendering the study null), which have an empirical effect on the study's aim (as one can infer from the DSM-V-TR description of the symptoms of such psycho-pathologies, assuming the DSM is a good-willed manual and not (((their))) way of controlling people. I digress. This point also fucks up subsequent statistical analysis.
Technically called an "Omitted variables bias".

4) Cross-sectional study.
A cross-sectional study by its nature is unable to assess causal links.
Acknowledged by the researchers:
the cross-sectional design precludes causal inference.
However, the researchers indulge in unwarranted hypothesizing that they themselves state being baseless:
[...] At the same time, considering the absence of temporality in cross-sectional designs, the observed relationship between having experienced DFSA and DFSA pornography consumption leads us to hypothesize that, in the absence of adequate social support, some DFSA survivors may resort to viewing such content to understand the episode even at the risk of revictimization. However, this hypothesis is not supported by empirical data, suggesting directions for future research. Regardless, this highlights the imperative to strengthen support systems for survivors of DFSA. Consequently, it is essential to conduct longitudinal studies that establish causal relationships and qualitative research that explores DFSA survivors’ experiences in depth. In the same way, related adjustment variables indicate that this is an issue in which global messages must be accompanied by other messages particularized according to gender, educational level, or country of origin.

5) The sample does not accurately represent the demographic.
Among respondents (800/1593, 50.2% female participants; mean age 27.0, SD 5.1 years), 78.4% (1233/1572) identified as heterosexual, and 52% (825/1587) held a university degree. Overall, 66.6% (1013/1521) reported consuming pornography in the previous year, with higher prevalence among male participants (638/753, 84.7%) than among female participants (370/762, 48.6%). DFSA pornography consumption was reported by 22.2% (167/753) of male participants and 11.3% (86/762) of female participants, and increased with overall pornography use frequency. Multivariate logistic regression indicated that DFSA perpetration (adjusted odds ratio 3.78, 95% CI 1.72-8.28; P<.001) and victimization (adjusted odds ratio 1.86, 95% CI 1.24-2.78; P=.003) were associated with DFSA pornography consumption.

The researchers seem to have forgotten to list the other factors that one can control in the "Results" section:
54.6% (689/1262) had a low to medium or low socioeconomic status, 91.4% (1446/1583) were Spanish, and 75.8% (1213/1601) had a left-wing political ideology.

1) The real percentage of 18-35 year old Spanish with a uni degree is about 40%;
2) About 28% of 18-35 year old Spanish have a non-heterosexual orientation;
3) About 40% of 18-35 year old Spanish are on the political left.
4) About 65-70% of 18-35 year old Spanish have a low to medium or low socioeconomic status (€2000 monthly or less of net income)
5) About 20% of 18-35 year old Spanish are 1st or 2nd generation migrants from other countries

What does this mean? It means that the study is garbanzo-tier even before considering actual calculations. Why?

The study population consisted of individuals aged 18 to 35 years residing in Spain, totaling 9,250,779 people in 2022, with 50.85% being men [32]. A minimum sample size of 1537 individuals was required, assuming 50% prevalence, 95% confidence, and a 2.5% margin of error, with a prevalence of 0.5 due to the lack of prior data as recommended by statistical guidelines [33].

[...]

Quota sampling was applied to ensure proportional representation by sex, age group (18-24 and 25-35 years), and region (17 autonomous communities) according to the demographic distribution of the Spanish population.

Researchers do not represent adequately the population of Spain aged between 18-35. Any statistical calculation done thenceforth is completely drugged by the skewed balance.


The initial sampling check is done, and it is not promising at all. Under these premises, the study should've been halted and remade from scratch with an actual representative sample and more precise representation via including factors such as certified ASPD, Psychopathy, Alcohol consumption during parties, Drug consumption during parties AT LEAST.

Oh but don't worry, for there is one particular passage that renders this whole paper scientifically dishonest, reveals the blatant HARKing and pushing of an ideological position and should make honest social scientists demand radiation for these "researchers". Of course, I will only reveal it at the end, for it will make much more sense then.


On to the actual data.


6) FUCK YOU MEAN 95% CI [1.72 - 8.28] ???????????????????????


I will assume throughout these sections that the reader does not know anything about statistics and linear regressions and allat bullshit (I barely know these things myself, but I know enough to talk about it).


Let's start from a quote:

Multivariate logistic regression indicated that DFSA perpetration (adjusted odds ratio 3.78, 95% CI 1.72-8.28; P<.001) and victimization (adjusted odds ratio 1.86, 95% CI 1.24-2.78; P=.003) were associated with DFSA pornography consumption.

Screaming The Voices GIF
I am falling into a state of madness.

We need to follow the process and then look at how they derived the results.
Regarding the type of pornography consumed, 22.2% (167/753) of male participants and 11.3% (86/762) of female participants reported consuming pornography with DFSA content (
table.gif
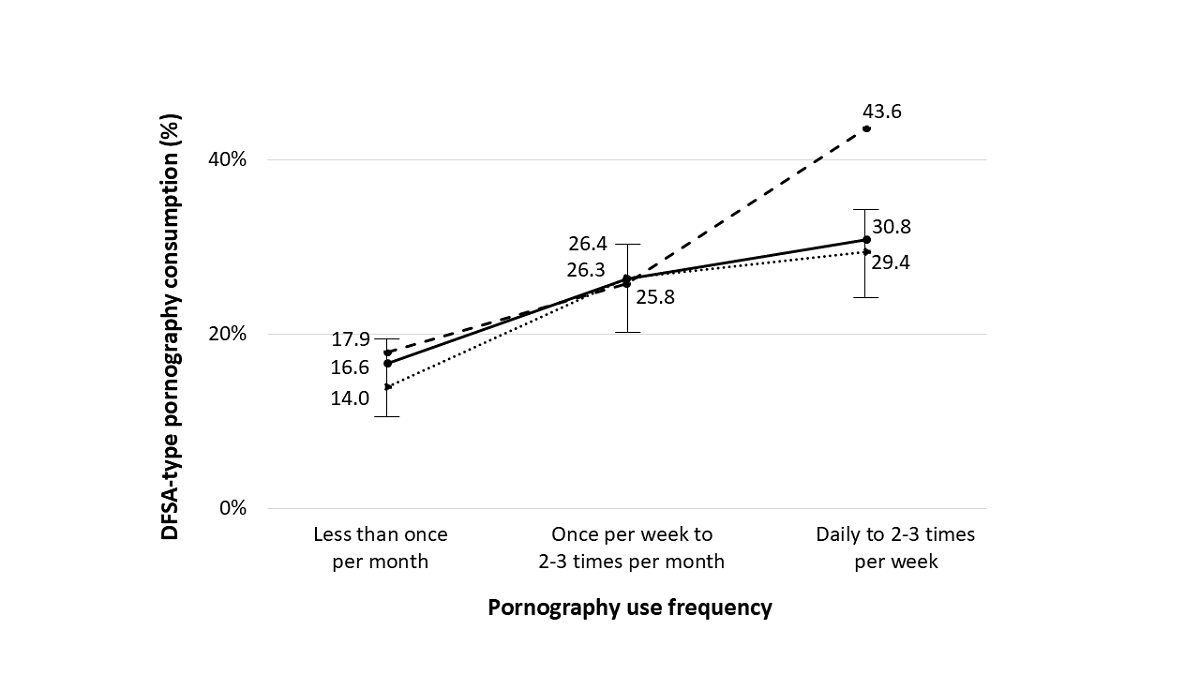
Table 2). The higher the frequency of pornography use, the greater the consumption of DFSA pornography. A total of 30.8% (115/373) of those who consumed pornography more frequently acknowledged having seen DFSA pornography (
96a7217c14541517beea8a7e6c2d550e.png
Figure 1).

The results of the bivariate analysis showed that the odds of having perpetrated DFSA at least once while partying were 6.27 times higher among those who consumed DFSA pornography (P<.001), whereas they were 3.01 times higher among those who had more frequent pornography consumption (daily or 2-3 times a week; P<.001). However, the results of the multivariate analysis model, adjusted for both variables and other sociodemographic characteristics, revealed that perpetrating DFSA while partying appeared only in relation to the type of pornography consumed, not its frequency. The odds of having perpetrated DFSA while partying were 3.78 times higher among people who reported consuming DFSA pornography than among those who did not (P<.001). Regarding other factors, in the multivariate analysis, DFSA perpetration was higher among male participants (adjusted odds ratio [aOR] 2.03, 95% CI 1.17-3.51; P=.01), nonheterosexual individuals (aOR 2.10, 95% CI 1.33-3.32; P<.001), and individuals of foreign origin (aOR 2.55, 95% CI 1.40-4.62; P=.002). The logistic model (χ^2_8=88.8; P<.001; McFadden pseudo-R2=0.123) fit the data well (Hosmer-Lemeshow χ28=7.5; P=.48;
table.gif
Table 3).


This is the key, this is where most of the shitfuckery goes on.

1) Table 3. The relationship between lifetime drug-facilitated sexual assault (DFSA) perpetration while partying and the type of pornography consumed and frequency of consumption (N=1482). a
Sociodemographic and behavioral variablesPerpetrated DFSA at any point in their life while partyingP valueCrude ORb (95% CI)Adjusted OR (95% CI)
YesNo
Type of pornography consumed, n (%)<.001
No consumption18 (3.6)485 (96.4)ReferenceReference
Without DFSA35 (4.6)719 (95.4)1.31 (0.73-2.34)0.91 (0.43-1.95)
With DFSA47 (18.9)202 (81.1)6.27 (3.55-11.06)c3.78 (1.72-8.28)d
Frequency of pornography consumption, n (%)<.001
Never to less than once per month33 (4.1)770 (95.9)ReferenceReference
Once per week to 2 to 3 times per month25 (7.5)310 (92.5)1.88 (1.10-3.22)d1.01 (0.49-2.06)
Daily to 2 to 3 times per week42 (11.4)326 (88.6)3.01 (1.87-4.83)c1.30 (0.65-2.59)
Sex, n (%)<.001
Female32 (4.1)757 (95.9)ReferenceReference
Male72 (9.2)711 (90.8)2.40 (1.56-3.68)c2.03 (1.17-3.51)d
Age (y), mean (SD)27 (5)27 (5).790.99 (0.96-1.03)1.00 (0.98-1.05)
Sexual orientation, n (%)<.001
Heterosexual61 (5.0)1162 (95.0)ReferenceReference
Nonheterosexual42 (12.6)292 (87.4)2.74 (1.81-4.14)c2.10 (1.33-3.32)d
Nationality, n (%)<.001
Spanish81 (5.7)1351 (94.3)ReferenceReference
Spanish and/or other20 (14.8)115 (85.2)2.90 (1.72-4.90)c2.55 (1.40-4.62)d
Educational level, n (%).68
University56 (6.9)759 (93.1)Reference—e
Nonuniversity48 (6.4)707 (93.6)0.92 (0.62-1.37)
a The multivariate model included as covariates those variables that showed a P value of <.05 in the bivariate analysis.

b OR: odds ratio.

c P<.001.

d P<.05.

e Variables not included in the multivariate model according to the results of the bivariate analysis.


THIS IS COMPLETE BULLSHIT

here's why.
The bivariate analysis works on a 2x2 Matrix of watching DFSA and perpetrating DFSA/watching DFSA and not perpetrating DFSA/not consuming and perpetrating DFSA/not consuming and not perpetrating DFSA.

The bivariate algorithm then calculates the odds of perpetratingg among consumers and divides it by the odds of perpetrating among non-consumers. With the data:

(47/202)/(18/485)=0.23267326732673267326732673267327/0.03711340206185567010309278350515=6.2692519251925192519251925192528 which is approximately 6.27.

HOWever. Take a glance at the 95% CI (Confidence Interval). This interval represents a very precise concept: 95 times out of 100 we sample the population with n=1482, the interval contains the true population parameter. What does this mean? It means that in reality, we do not know if this phenomenon is (under the bivariate, extremely imperfect algorithm for the study case) that there is a 3.55 factor increase in DFSAs among DFSA consumers, or a 11.06 factor increase. The superior extreme is more than 3 times the lower extreme, and even in social sciences, this is indicative that the model cannot predict the phenomenon. It would be like having a scale, and when we put a 627g object on it, the scale reads a value anywhere between 355g and 1106g. It has no predictive value. But the cOR of the bivariate is virtually useless here. What we need is a multivariate analysis because there are multiple variables at play here. Hence, the aOR.

The multivariate analysis is inherently flawed here because the major variables of "alcohol consumption", "drug consumption", "ASPD/Psychopathy/Sociopathy/other such psycho-pathologies" are ABSENT. This reflects on another value, the Pseudo-R-squared value, touched upon later.

The multivariate analysis is done, here, counting only the 5 factors that have a p-value less than 0.05 in the bivariate analysis. Hence, Age (.79) and Educational status (.68) are not inserted. We're left with a 5 variables function that iterates in a matrix of these values and maximizes the probability of observing the real distribution of the 1482 participants.

The algorithm calculates the beta coefficients of the variables and the aOR (adjusted Odds Ratio) is the exponential of the beta value (here, 3.78 for "Consumes DFSA porn".

Once again, consult the 95% CI: (1.72-8.28). There is no predictive capacity in this. It's either a mild increase, or a social plague catastrophe. The result is that "yeah, it's anywhere between 1.72 and 8.28" which is basically like saying "yeah there is anywhere between a 0 and a 100% chance of this happening" (exaggerated, but I need to get the point across of what this means in simple terms).

If you look at the row above, you see that the 95% CI has 1 in it. It means that there is absolutely no correlation (in this model) between watching porn of the non-DFSA kind and committing DFSA, something that was already visible in the bivariate.
Frequency of pornography is also irrelevant as pointed out by the researchers themselves.


What can also be seen is the stat on males, non-heterosexuals and immigrants.


So we have an utterly useless model for the purpose of the study (determining a correlative link between consumption of DFSA porn and perpetrating DFSA), with the results being "yeah anywhere between mild increase and full-blown apocalypse".

The p-value doesn't mean shit when it comes to these aORs and CIs, it merely means that "yes, actually, this model is this faulty".

And the ultimate proof is the McFadden Pseudo-R^2 being so abysmally low (0.123).
The McFadden Pseudo-R^2 is a type of check that is done to see if the model fits the data. Basically through it you can check the amount of variance, or "how much of the phenomenon is actually explained by the model". Here, a measly 12.3% of the phenomenon of DFSA is explained by the multivariate analysis, which just means this model is USELESS AS FUCK, because it leaves an 87.7% unaccounted (GEE I WONDER WHAT WOULD'VE HAPPENED HAD IT INTEGRATED OTHER VARIABLES HMMMMMMGE).

The chi^2 is useless as fuck here.

The first test is a Likelihood Ratio Test: "What's the probability that the likelihood of this multivariate (in this case, 8-variate) model is less than the likelihood of a 0-variate model (which is the null model)?". It being 88.8 with p<0.001 is due to the sample size of 1482, infinitely bigger than the 47 people that consume and perpetrate DFSA. This because chi^2 = 2*(ln(L_M)-ln(L_0)) where

L_M = likelihood of the model
L_0 = likelihood of the model without predictors (the variables)

now, ln(L) = sum from i=0 to i=N of ln(p_i) where N is the sample size, p_i is the probability of the event (in this case, perpetrating and consuming DFSA) calculated on each participant.

this means that the chi^2 value is directly proportional to the sample size. Its value of 88.8 is solely due to the sample size of 1482 obfuscating the irrelevancy of the model.

Why is the pseudo-R^2 this low, then? Because:

R^2 (of McFadden) = 1 - ln(L_M)/ln(L_0)

Applying the chi^2 formula here:

R^2 = -chi^2/2*ln(L_0)

What happens here is that even if the chi^2 value is apparently good, the denominator grows in a way that is directly proportional to N, the sample size.

Let's apply it to this study:

We need to find ln(L_0):

we know that ln(L_M)-ln(L_0)=88.8/2=44.4

we also know that 0.123 = 1 - ln(L_M)/ln(L_0) = [ln(L_0) - ln(L_M)]/ln(L_0) = -44.4/ln(L_0) so we find that ln(L_0) = -44.4/0.123 = -361 (approx)

which is coherent with the fact that L_0 is between 0 and 1 and logarithms of values between 0 and 1 are negative.

With this, we find that the L_M is -316.6 approx -317.

now, -chi^2 = R^2 * 2*ln(L_0) = 0.123 * -722 = -88.8 so that chi^2 = 88.8 as we have.

So?


So chi^2 is no parameter for judging the predictive ability of anything. It is merely a sign that "there is something in the data, and it's not due to white noise" the REAL parameter by which to judge predictive ability is the R^2, which is pathetic (0.123).


I need you to understand intuitively what is happening in this statistical hell.


There are 1482 people that constitute the sample. 100 of these perpetrate. 1382 of these don't. This is the base model without predictors, the null model. The equation that represents it would be log(p/1-p)=beta_0. beta_0 is a constant in the null model, also called "intercept".

The probability to extract a perpetrator out of the 1482 is 100/1482=0.067476;
The probability to extract a non-perp is 1382/1482=1-0.067476=0.932524.

Recall the earlier formula for ln(L). Here, there is a flat sum of 100*ln(0.067476) + 1382*ln(0.932524) = -366 (close enough to -361, approx errors and shit).

Then let's consider the 8-variate model. It assigns different probabilities to different cells in a matrix which represent intersectionality of variables. The likelihood is bound to be higher than that of the base model because of this, it is assigning "more correct" probabilities to different outcomes. The equation for this model would be log(p/1-p) = beta_0+beta_1X_1+...+beta_8X_8 (8 variables X_1 thru X_8 and 8 beta coefficients)

However, the summation is always done on the whole sample. This means that a low initial sample can have a chi^2 value below the minimum acceptance value (about 15.5 for 8-varied models) and signal that the model is shit as fuck, but a high initial sample with the same data of perps will pump up the model to high chi^2 values, however the R^2 will still be abysmally low to signal that the model is not explaining shit.

Recall the chi^2 formula: chi^2 = 2*(ln(L_M)-ln(L_0))

This is just two times the distance between ln(L_0) and ln(L_M), which is the difference in likelihood between the base and 8-variate model. What's happening? The 8vmodel (again, JFL if it wasn't) has a likelihood, ln(L_M), closer to 0 than the base model. This means the 8vmodel is getting rid of some chaos and providing explanation for some percentage of the phenomena.

The chi^2 formula has a minimum acceptance value, which for 8vmodels is about 15.5. What the chi^2 measures is simply if and by how much the proposed 8vmodel is "picking up explanations of phenomena".

The true measure of the predictive ability of the model is the R^2 though. By dividing the -chi^2 by the 2*ln(L_0) the R^2 is effectively measuring the percentage of "chaos" that is being "explained" by the model, essentially dividing the movement distance by the initial value. (In this case, a whopping 12.3% of it geg). It is always a number between 0 and 1 due to this.


The second test is the Goodness of Fit test of Hosmer-Lemeshow. It divides the sample in risk deciles and confronts the frequencies of "Yes" and "No" observed in the sample with those provided by the model. "Does my model fit the data well?". The higher the p value here, the better, because you're checking the truth value of the null Hypothesis (that the model fits the data perfectly) so it has to be closer to 1 than to 0. The problem is that with 47 people who consume and perpetrate DFSA, the sample is too scarce locally to be able to reasonably pick up the distortion of the model. Still, the p-value isn't even that high (p=.48 is basically a coin toss, which I wouldn't trust to fit the data personally).

This is the equation that represents it:

1780366072775

- g ranging from 1 to 10 is the division in risk deciles, 1 being lowest risk and 10 being highest risk (as established by the 8-variate model);
- O_(1g) and E_(1g) are respectively the number of positive cases (in this case, perps) observed and expected by the 8-variate model.
- O_(0g) and E_(0g) are respectively the number of negative cases (in this case, those that do not perp) observed and expected by the 8-variant model.

What is happening here?

The 8-variate model assesses the risk for each decile. Then, it estimates (E_1 and E_0) the amount of people that will perp and not perp (1482/10=148 (rounded down) * risk probability calculated for that decile).

Then, for both the 1 (perp) event and 0 (non-perp) event, the distance between the observed and estimated values is squared and divided by the expected value, then they are summed and this for each decile.

What's the problem here? Without enough data, the lower risk deciles return irrelevant values that are in the order of 10^-1 or even 10^-2; let's assume the risk value of the 1st quintile to be 0.5%; then 148*0.005=0.74. That is the expected value for the 1 event. The expected value for the 0 event is 148-0.74= 147.26. Let us assume that the observable reality has O_(1,1)=0 and O_(0,1)=148.

The formula returns [(0-0.74)^2/0.74]+(148-147.26)^2/147.26=0.74+0.00371859296482412060301507537688=0.74 approx.


So when there is a lack of data (for instance, 100 perps in 1482 people), of course the chi^2_(HL) will be low (has to be lower than 15.5 for this test), returning a p value great enough to pass the test.

What would happen with more data?

Let's assume the sample size is N=12422 (for no particular reason at all) with 385 perps (for no particular reason at all)
Assume there were even just a handful of perps, say, O_(1,1)=3, say the risk value was 0.5% for the first decile: E_(1,1)=1242*0.005=6.21 [THIS IS MERELY TO SHOW HOW LACK OF DATA SKEWS THE TEST]
Do this shit for yourself, it's already fucking 4:40 AM and I've been writing this for 7 hrs, anyways the result is about 1.7 which is 2.5 times the original value. Very likely the chi^2_(HL) value will be higher than 15.5, completely fucking up the test. I'm tired. I wrote this after the below considerations and before the discussions section. the voices are winning ADHBAIDFHBCDFHBGA

Regarding DFSA victimization while partying, the results of the bivariate analysis were largely consistent with those of the multivariate analysis. In this model, the probability was 1.86 times higher among DFSA pornography users (95% CI 1.24-2.78, P=.003). This association was also 3.36 (95% CI 2.53-4.46) times higher among female participants (P<.001), 1.67 (95% CI 1.28-2.20) times higher among nonheterosexual individuals (P<.001), 1.65 (95% CI 1.10-2.47) times higher among individuals of foreign origin (P=.01), and 1.36 (95% CI 1.09-1.71) times higher among those with lower educational levels (P=.008). The overall model (χ29=128.4; P<.001) explained 6.6% of the variance (McFadden pseudo-R2=0.066) and showed good fit to the data (Hosmer-Lemeshow χ28=4.5; P=.81;
table.gif
Table 4).

Everything said above applies here too. With the only difference that this SHITTY fucking model accounts for... 6.6% of the variance in victimization. WHERE IS THE REMAINING 93.4%???? I already replied above as to why this is. Literally this model fails to explain why 93.4% of the DFSA happens irl.

This study is fucking bullshit. But before heading to the "Discussion" section, I want to highlight why this study should be studied in statistics courses as the most baseless, politically motivated, biased piece of shit ever seen ever.

50% PREVALENCE HAHAHAHAHAHAHAHAHAHAH


A minimum sample size of 1537 individuals was required, assuming 50% prevalence, 95% confidence, and a 2.5% margin of error, with a prevalence of 0.5 due to the lack of prior data as recommended by statistical guidelines

This was calculated using a formula that returns the minimum number of participants a study has to have to be valid, Cochran's Formula:
N=[Z^2*p*(1-p)]/E^2 where:

Z = 1.96 for 95% confidence;
p = Prevalence (here 0.5)
E = margin of error (here 0.025)

Plug the numbers in. The result? 1536.6 so 1537.

What's the problem here?


They used the prevalence value that would net them the least amount of participants to involve in the study (p*(1-p) has its maximum at p=0.5, assuming 0<p<1, extremes included)

However, assuming a prevalence of 50% for a literal fucking crime goes against basic principles of statistics regression. The standard is to assume a prevalence of 3% and a relative error margin of 10%

the corrected formula would be
N=[Z^2(1-p)]/((E^2)*p) where:
Z=1.96 for 95% confidence:
p= Prevalence (new: 0.03)
E = margin of RELATIVE error (new: 0.10)

The result? 12421.16 which is 12422.

TWELVE THOUSAND FOUR HUNDRER AND TWENTY FUCKING TWO PARTICIPANTS.

Why does this matter at all?

The Confidence Interval used in this study is calculated on Odds Ratios, so the extremes are not linear, but exponential.

the confidence interval is of the form [e^(beta-1.96*SE), e^(beta+1.96*SE] (1.96 is the Z parameter of 95% Confidence from before)
And the SE is approximated by the function 1/sqrt(x) (not in multivariates, the SE is higher due to the multivariate nature)

This means that the more data in the cell "Consumes DFSA porn and perpetrates DFSA", the less the value of the SE, and thus the less the amplitude of the interval, meaning the precision is higher.

These fucking retards, though, only had 47 data points. This effectively made the extremes of the CI explode and all the precision was lost.

With 12422 participants, though, assuming a found prevalence of 3.1% (WHICH IS CORROBORATED EVEN BY THIS SHIT FUCKING STUDY BECAUSE 47/1482 = 0.0317 AAAAAAAAAAAAAAAAAAAAAAAAAAAAAAAA THE VOICES THE VOICES AAAAAAAAAAAAAAAAAAAAAAA THEY'RE WINNING AAAAAAAAAAAAAAAA) there would have been 385 data points, and the SE would've been wayyyy lower.


In fact, let us calculate the SE with n=47.

SE = [ln(superior extreme of the CI)-ln(inferior extreme of the CI)]/(2*.1.96)=a bunch of numbers=0.4009 approx 0.4010.

This is coherent with a "Consumes DFSA porn" beta value that is ln(aOR)=ln(3.78)=1.32972400 approx 1.330.
Check = [e^(1.33-1.96*0.401),e^(1.33+1.96*0.401)]=[1.723, 8.2975] approx [1.72, 8.3] which IS EXACTLY WHAT THE RESEARCHERS FOUND.


As I said, this is incredibly irrelevant to any predictive capacity: "Hey I measured my temperature and the thermometer said my temp is anywhere between 35°C and 42°C!!!!". Worthless.

Let us assume the same conditions (3.1% prevalence, 95% Confidence, 10% Relative Error Margin, 3.78 aOR, 1.330 Beta Value, but n=385 perpetrators that consume DFSA porn (3.1% of 12422)) and let's run the calculations to see the new CI.

New SE = 0.401*sqrt(47/385)=0.1401.
New CI = MATH MATH MATH = [2.87 - 4.97]

way, WAYYYY more precise. BUT.

This cannot realistically happen. This is assuming too many things:
1) "Linearly-Geometrically" Diminishing SE value. In reality, with a sample nearly 8 times larger, the covariance would likely completely alter the values, the aOR would not still be 3.87, the beta value would change, and thus the CI.
2) Introducing the "forgotten variables" (mentioned like 5-6 times already) would introduce causes that are empirically much, much more relevant than these ones (as one could assume by the 0.123 McFadden value JFL, 87.7% of the cases of DFSA cannot be explained by this model JFL JFL JFL)
3) Having the sample reflect accurately real life demographics would likely increase other covariances' relevancy, further diminishing the aOR of "Consumes DFSA", and I think [PERSONAL OPINION] the CI's inferior extreme could even be veeeeeeeeery close to 1, from above.


So, what do we actually know?

1) This model is worthless.
2) Any conclusions one can draw from this model are inappropriate as a result.
3) Psychiatry is not a science and social sciences are not scientific at all.
4) Torture data, and they will tell you any story you want to know, or something.
Discussion Section

Holy JFL.
This study confirms the widespread use of pornography among young people, indicating that those who use it more frequently are also more likely to consume sexually violent pornography. Additionally, evidence was provided regarding the relationship between the use of sexually violent pornography and both DFSA perpetration and victimization.
proved to be faulty as fuck and likely irrelevant when compared to the "forgotten variables"

In this study, 2 out of 3 young people (1013/1521, 66.6%) admitted to consuming pornography, with consumption being almost twice as high in male participants compared to female participants. These results align with a recent nationwide study in Spain, according to which 6 out of 10 young people aged 16 to 29 years admitted to using pornography, with 72.1% being men and 59.3% being women [19]. Similarly, other studies have found that approximately 70% of men and 30% of women use pornography in high-income countries [17,18]. Regarding frequency, in our study, almost half (333/753, 44.2%) of all male participants consumed pornography daily or 2 to 3 times a week. Among female participants, consumption was much less frequent. These figures are slightly higher than those reported in similar studies conducted in Spain [19] and Europe [36]. The data from our study are more up-to-date and are based on more representative samples. Therefore, they may reflect current consumption, especially considering that pornography consumption has been growing in recent years [22,37].
so? this was not the point of the study at all.
In terms of type of pornography, more than 20% of male participants (167/753, 22.2%) and 10% of female participants (86/762, 11.3%) in our study reported consumption of pornography featuring scenes in which a person is asleep, unconscious, or under the influence of alcohol or other drugs (referred to as DFSA pornography). These figures cannot be directly compared as there is currently no scientific literature providing prevalence data on the consumption of violent pornographic content specifically depicting DFSA situations. As such, comparisons could be made with broader data on the consumption of violent pornography. Some studies indicate that 10% of adolescents have been exposed to violent pornography, with a gradual increase in violent themes as age progresses [38]. In this regard, a study in New Zealand highlighted how easily young people can be exposed to nonconsensual sexual behavior in online pornography, including scenes of sexual activity while someone is sleeping [39], findings similar to those described by other authors [30,31]. In Spain, 40.2% of individuals have viewed pornographic content classified as high in violence, particularly degrading, or humiliating, and 16.6% acknowledge doing so with high or moderate frequency (18.2% of men and 14.5% of women) [19]. Additionally, 5.2% of men and 6.9% of women indicate that the presence of violence is the factor that influences them the most when selecting pornographic material [19]. These results show the magnitude of pornography consumption of this type. There are many related considerations, but these are beyond the scope of this study. What we must emphasize again is that many young people acquire their sexual education through pornography (in the absence of other forms of education) [19,40], with a significant portion of this pornography being of a violent nature.
DFSA pornography isn't necessarily more violent than any other type. I don't want to dismantle each of the studies, let's suppose they are reliable. Then what? How does this data tie into your study? You have "proven" that there is no precision in the data and no conclusion can be drawn off of your faulty fucking model. Good job. Again, you cannot explain 87.7% of the DFSA perpetrators' variance and 93.4% of the victims' variance. Your model is incredibly useless. YOU YOURSELVES have established the statistical irrelevancy of the Confidence Interval of frequency and type of porn watched, barring DFSA and DFSA ONLY, YOU DID NOT EVEN ACCOUNT FOR "VIOLENT PORN".
According to our study, using DFSA pornography is related to approximately fourfold higher odds of perpetrated DFSA while partying. Similarly, other researchers have observed a connection between sexual assault perpetration and the use of violent pornography [23,41].
Your aOR is faulty, your R^2 value is enough for me to discount your shit.
Models explaining this relationship suggest that the risk of perpetration correlates with male pornography users who have high levels of hostility and sexual promiscuity [42]. Exposure to violent pornography also shapes sexual behavior by reinforcing scripts that are perceived as normative, acceptable, and gratifying, which are then activated and applied in dating and sexual relationships [43]. This correlation was obtained in analyses adjusting for other factors.
How are these scripts perceived as normative or acceptable and how do they explain the 87.7% and 93.4% that you couldn't account for?
In addition to the type of pornography consumption, it was noted in this study that there were more perpetrators among male participants, foreigners, and nonheterosexual individuals. The presence of men in these studies is nothing new [23,44], hence the importance of adjusting the results by gender. Regarding country of origin and sexual orientation, these categories encompass highly diverse populations. These groups are heterogeneous and shaped by intersecting social determinants that may influence risk and experiences in complex ways [45]. Further research is needed stratifying by country of origin and other relevant factors [46,47].
KEK FUCKING MAO at the politicized double standards.
"Men? Duh, of course they are here".
"Faggots, troons and niggers? WOAH WOAH WOAH, there are 69 googolplexes relevant factors like COUNTRY OF ORIGIN and the HETEROGENEOUS NATURE of those groups (because everyone knows men are one entity silly, take your lithium it's time for your (((meds)))). Let's not get ahead of ourselves here. 10 million more euros in bullshit research to produce worthless papers are needed."
Concerning victimization, experiencing DFSA while partying was twice as frequent among users of DFSA pornography content. Although various studies have indicated a link between sexual victimization and exposure to pornography [44,48,49], there is currently no known research specifically addressing DFSA. On the one hand, many studies on violence against women suggest that conventional pornography often depicts violent scenes that sexually degrade and objectify women [23,28,29,40]. It is noted that female sexual objectification in pornography is linked to a higher likelihood of sexual victimization in young women due to the normalization of or desensitization to violent sexual behaviors [50]. On the other hand, studies linking violence using psychoactive substances and pornography primarily focus on alcohol, consistently finding an increased risk of sexual victimization among women who consume pornography [48]. While it is difficult to infer a cause, it has been suggested that increased exposure to violent pornography and its normalization, combined with the effects of alcohol, may impair the initial ability to detect an aggression
ARE YOU FUCKING SERIOUS RIGHT NOW??????? YOU'RE JUST GOING TO GLOSS OVER ALCOHOL AND DRUGS????????????????????????????????????????????? WHEN YOU CAN'T EXPLAIN 93.4% OF THE VICTIMIZATIONS??????????????????????????????????????????????????????????????????????????????????? CAN YOU FUCKING STOP LOOKING AWAY FROM REALITY FOR A SECOND???
At the same time, considering the absence of temporality in cross-sectional designs, the observed relationship between having experienced DFSA and DFSA pornography consumption leads us to hypothesize that, in the absence of adequate social support, some DFSA survivors may resort to viewing such content to understand the episode even at the risk of revictimization. However, this hypothesis is not supported by empirical data, suggesting directions for future research.
WHAT???? YOU'RE ADMITTING THE ILLICIT NATURE OF DRAWING CAUSAL HYPOTHESES, YET DOING SO ANYWAYS??????????????????????? AHAHDUSHDQJKWAD BGEQKFHG BWEIFKRJFHGBSRUIKFH BRHJKFHGDJHFHJDHGFJDHAHHAHAHHAH DUOHDIUEHFWEFH THE VOICES HAHAHAAHAHHAHAHAHHAAHAHAHAHAHAH
Laugh Laughing GIF

Regardless, this highlights the imperative to strengthen support systems for survivors of DFSA. Consequently, it is essential to conduct longitudinal studies that establish causal relationships and qualitative research that explores DFSA survivors’ experiences in depth. In the same way, related adjustment variables indicate that this is an issue in which global messages must be accompanied by other messages particularized according to gender, educational level, or country of origin.
DUDE, YOUR FUCKING WORTHLESS MODEL literally shat out a p value greater than .05 for educational level. AND COUNTRY OF ORIGIN? YOU DIDN'T ACCOUNT FOR THAT DJQW DHBQLKIU DHGDHHDHDHDOIHD.
Considering the high prevalence of DFSA experiences in youth party settings [6] and the fact that many young people turn to pornography as a source of sexual education [19], the influence of DFSA-themed pornography in normalizing this form of sexual violence among young people is deeply concerning. While we cannot establish a causal relationship, there is a clear correlation between DFSA—whether perpetration or victimization—and the consumption of this specific type of pornography. This correlation does not emerge when considering the overall quantity of pornography consumed. Although higher levels of consumption are related to the consumption of violent porn, it is specifically this violent content that shows a significant correlation with DFSA. Consequently, we should not wait for causal evidence to implement the necessary sexual health promotion interventions. Preventive action is essential, particularly to ensure that the normalization of sexual behaviors is not shaped primarily by the content of the pornography that young people consume.
Do you understand this quote?
They're saying they don't give a fuck if they did a cross-study, that cannot reveal causal links. They don't give a fuck if pornography consumption is not even correlated with perpetrating DFSA. They don't give a fuck. (((They))) will "implement the necessary sexual health promotion interventions" because that was the entire goal of this bullshit paper. Provide an excuse, even a poorly crafted one, for policy. Don't believe me? Look at who funded this paper. I will tell you in a minute.
This study’s findings contribute to addressing some global challenges highlighted by the United Nations Sustainable Development Goals, particularly those aimed at ending violence and fostering just societies. As DFSA is a paradigmatic example of how violence affects the most vulnerable individuals, this study reinforces the commitment to “leave no one behind” in achieving sustainability.
AAAAAAAAAAAAAAAA POLITICS POLITCSIS QASAAASPAJWDIòOJQAWDIOJHQWAIKDUHJDIQAUWKHDIQKAHD AAAAAAAAAAAAAAAAAA (thanks for the funding daddy UN and EU) AAAAAAAAAAAAAAAAAAAAAAAAAAAAAAAAAAAAAAAAAAAAAAAAAAAAAAAA.
Despite these limitations, this study provides novel and valuable evidence on DFSA-related pornographic content and its association with sexual violence perpetration and victimization in party contexts.
provides literally no evidence.
The use of pornography depicting nonconsensual sex involving individuals who are asleep, unconscious, or under the influence of alcohol or other drugs correlates with experiences of DFSA perpetration and victimization in youth party settings.
no it DOESN'T.
This association emphasizes the importance of addressing the impact of pornography as a primary source of sexual knowledge for young people, particularly in a context in which the widespread use of pornography intersects with insufficient sexual education and a lack of effective mechanisms to control consumption among minors. Future public health strategies may include ongoing research regarding the implications of pornography for sexual violence. From a public health policy perspective, it is recommended to provide training programs for educators and clinicians to enhance their skills in sex education considering the realities of pornography and its influence on young people. Accurate information on these realities should also be integrated into comprehensive sexual education initiatives and educational materials aimed directly at youth. Finally, legal responsibilities should be expanded, and the obligations of online pornography distribution platforms should be strengthened to improve the monitoring, filtering, and removal of violent content.
I'll leave the commenting to you. It's 5 AM. 8 hrs writing this shit. wtv. more online legislation. more censorship. more power to (((them))) and women. women most affected btw.

Data Availability​

The datasets generated or analyzed during this study are available from the corresponding author on reasonable request.
should've made it public for ease of access and trust.

Funding​

This work was funded by the Margarita Salas postdoctoral grant financed by the University of Alcalá, NextGenerationEU, and the Spanish Ministry of Universities, as well as by the University Institute for Research in Police Sciences (IUICP-2023/07). The funding source had no involvement in the study.
postdoc grants are fucking cancerous, NextGenerationEU is post-covid funds (5 yrs later still pumping funds OK), HOW IS THIS HELPING TO RECOVER FROM COVID ASDHJNQWOAHD NQLIAHD ILUHIUDF. Also legit funding from the "University Institute for Research in Police Sciences", but absolutely no involvement in the study (trust me bro) GEG.

Acknowledgments​


The authors thank the study participants for their contribution and The Cocktail Analysis for fieldwork support. The authors acknowledge that a generative artificial intelligence tool (ChatGPT; OpenAI) was used exclusively to assist with language editing and phrasing improvements. The authors verified all content for accuracy and take full responsibility for the manuscript’s content.
I want to die so fucking bad ChatGPT and OpenAI written papers SJWIOPDJEOòFCHJWLIFUKWHFUWEHF.


Why do I think they HARKed the study?

It's not really HARK (Hypothesizing After Results are Known) but more of a conditioned study (hehe I fucking baited you HAHAHAHAHAHA):
Nobody had thought of studying this shit before; there was no internationally validated questionnaire for DFSA perpetration and porn consumption; the statistics are extremely jarring and misleading and the model is worthless; the ideological tendencies are very potent; funded by the literal "University Institute for Research in Police Sciences"; pushing for legislation and "sexual health awareness" stuff when you have a literal nothingburger; avoiding alcohol and drug consumption as covariates; shit sample that doesn't represent the Spanish population, instead represents liberal leftards university partygoers, literal fratfagboys; hastily crafted sample size likely due to high cost of finding 12422 people that could represent the spanish population decently and maintaining a study with them, applying a textbook technicality that shouldn't apply when investigating crimes; will to infer causal links from a cross-sectional study; prolly more shit I'm forgetting.


if you want, read this thread I made:

if you want, read why I think psychiatry is retarded and the DSM is stupid cultish propaganda:

I am not a social scientist, just a mathematics undergrad. Feel free to dismantle my statistics knowledge if you know more than me. Tell me directly if that is the case. this study made my eyes bleed.

 
Last edited:
8 fucking hours of writing I severely underestimated my autism
 
This is one of the worst papers I have ever read in terms of methodology. Honestly abhorrent.

1) Insanely low sample size.
1600 people to represent the whole segment of 18-35 is nuts. Any generalization is extremely risky, without even considering the rest of the paper, just on this notion alone. (I will explain why they ran this shit on 1600 people at the end of the comment, be prepared because it will make you cry due to the sheer amounts of cringe and disgust for the profession of "social sciences researcher").


2) Selection bias.

acknowledged by the researchers:

It definitely introduced selection bias. 100k registered members who get on those platforms solely for the incentives (money, gift cards) and realistically only care about optimization of revenue.
Justified as follows:

Detached from reality.

3) Social desirability bias.

acknowledged by the researchers:

Why? Because if you're asking people "hey have you committed this morally depraved and illegal act? we aren't collecting any info, source: trust me bro" you will always get downplayed results. Always. Both on the victim and perpetrator parts.


Not naming the provider of anonymous surveys = no guarantee that it was actually anonymous.

Here is the appended questionnaire:

The questionnaire has non-trivial issues:
1) Overlooking consumption of alcohol and drugs during parties. This is a major point that completely fucks up the statistical analysis, touched upon later;
2) Flattening a 1-10 spectrum of political opinions into a dichotomy (presumably 1-5 Left, 6-10 Right);
3) Flattening a 1-10 spectrum of such pornographic content as the above mentions, into a dichotomy (presumably 1 No, 2-10 Yes), which is is in extreme bad faith;
4) Not including female rapist's vagina/anus being forcefully penetrated with a male's penis (worded extremely poorly because I am retarded, it's the usual issue of rape laws being incomplete);
5) Not including certified diagnoses of psycho-pathologies such as ASPD, Psychopathy, Sociopathy etc. (which would be dubious unless rigidly certified through methods that would disrupt the anonymity of the respondents, rendering the study null), which have an empirical effect on the study's aim (as one can infer from the DSM-V-TR description of the symptoms of such psycho-pathologies, assuming the DSM is a good-willed manual and not (((their))) way of controlling people. I digress. This point also fucks up subsequent statistical analysis.
Technically called an "Omitted variables bias".

4) Cross-sectional study.
A cross-sectional study by its nature is unable to assess causal links.
Acknowledged by the researchers:

However, the researchers indulge in unwarranted hypothesizing that they themselves state being baseless:


5) The sample does not accurately represent the demographic.


The researchers seem to have forgotten to list the other factors that one can control in the "Results" section:


1) The real percentage of 18-35 year old Spanish with a uni degree is about 40%;
2) About 28% of 18-35 year old Spanish have a non-heterosexual orientation;
3) About 40% of 18-35 year old Spanish are on the political left.
4) About 65-70% of 18-35 year old Spanish have a low to medium or low socioeconomic status (€2000 monthly or less of net income)
5) About 20% of 18-35 year old Spanish are 1st or 2nd generation migrants from other countries

What does this mean? It means that the study is garbanzo-tier even before considering actual calculations. Why?


Researchers do not represent adequately the population of Spain aged between 18-35. Any statistical calculation done thenceforth is completely drugged by the skewed balance.


The initial sampling check is done, and it is not promising at all. Under these premises, the study should've been halted and remade from scratch with an actual representative sample and more precise representation via including factors such as certified ASPD, Psychopathy, Alcohol consumption during parties, Drug consumption during parties AT LEAST.

Oh but don't worry, for there is one particular passage that renders this whole paper scientifically dishonest, reveals the blatant HARKing and pushing of an ideological position and should make honest social scientists demand radiation for these "researchers". Of course, I will only reveal it at the end, for it will make much more sense then.


On to the actual data.


6) FUCK YOU MEAN 95% CI [1.72 - 8.28] ???????????????????????


I will assume throughout these sections that the reader does not know anything about statistics and linear regressions and allat bullshit (I barely know these things myself, but I know enough to talk about it).


Let's start from a quote:


Screaming The Voices GIF
I am falling into a state of madness.

We need to follow the process and then look at how they derived the results.


This is the key, this is where most of the shitfuckery goes on.

1) Table 3. The relationship between lifetime drug-facilitated sexual assault (DFSA) perpetration while partying and the type of pornography consumed and frequency of consumption (N=1482). a
Sociodemographic and behavioral variablesPerpetrated DFSA at any point in their life while partyingP valueCrude ORb (95% CI)Adjusted OR (95% CI)
YesNo
Type of pornography consumed, n (%)<.001
No consumption18 (3.6)485 (96.4)ReferenceReference
Without DFSA35 (4.6)719 (95.4)1.31 (0.73-2.34)0.91 (0.43-1.95)
With DFSA47 (18.9)202 (81.1)6.27 (3.55-11.06)c3.78 (1.72-8.28)d
Frequency of pornography consumption, n (%)<.001
Never to less than once per month33 (4.1)770 (95.9)ReferenceReference
Once per week to 2 to 3 times per month25 (7.5)310 (92.5)1.88 (1.10-3.22)d1.01 (0.49-2.06)
Daily to 2 to 3 times per week42 (11.4)326 (88.6)3.01 (1.87-4.83)c1.30 (0.65-2.59)
Sex, n (%)<.001
Female32 (4.1)757 (95.9)ReferenceReference
Male72 (9.2)711 (90.8)2.40 (1.56-3.68)c2.03 (1.17-3.51)d
Age (y), mean (SD)27 (5)27 (5).790.99 (0.96-1.03)1.00 (0.98-1.05)
Sexual orientation, n (%)<.001
Heterosexual61 (5.0)1162 (95.0)ReferenceReference
Nonheterosexual42 (12.6)292 (87.4)2.74 (1.81-4.14)c2.10 (1.33-3.32)d
Nationality, n (%)<.001
Spanish81 (5.7)1351 (94.3)ReferenceReference
Spanish and/or other20 (14.8)115 (85.2)2.90 (1.72-4.90)c2.55 (1.40-4.62)d
Educational level, n (%).68
University56 (6.9)759 (93.1)Reference—e
Nonuniversity48 (6.4)707 (93.6)0.92 (0.62-1.37)
a The multivariate model included as covariates those variables that showed a P value of <.05 in the bivariate analysis.

b OR: odds ratio.

c P<.001.

d P<.05.

e Variables not included in the multivariate model according to the results of the bivariate analysis.


THIS IS COMPLETE BULLSHIT

here's why.
The bivariate analysis works on a 2x2 Matrix of watching DFSA and perpetrating DFSA/watching DFSA and not perpetrating DFSA/not consuming and perpetrating DFSA/not consuming and not perpetrating DFSA.

The bivariate algorithm then calculates the odds of perpetratingg among consumers and divides it by the odds of perpetrating among non-consumers. With the data:

(47/202)/(18/485)=0.23267326732673267326732673267327/0.03711340206185567010309278350515=6.2692519251925192519251925192528 which is approximately 6.27.

HOWever. Take a glance at the 95% CI (Confidence Interval). This interval represents a very precise concept: 95 times out of 100 we sample the population with n=1482, the interval contains the true population parameter. What does this mean? It means that in reality, we do not know if this phenomenon is (under the bivariate, extremely imperfect algorithm for the study case) that there is a 3.55 factor increase in DFSAs among DFSA consumers, or a 11.06 factor increase. The superior extreme is more than 3 times the lower extreme, and even in social sciences, this is indicative that the model cannot predict the phenomenon. It would be like having a scale, and when we put a 627g object on it, the scale reads a value anywhere between 355g and 1106g. It has no predictive value. But the cOR of the bivariate is virtually useless here. What we need is a multivariate analysis because there are multiple variables at play here. Hence, the aOR.

The multivariate analysis is inherently flawed here because the major variables of "alcohol consumption", "drug consumption", "ASPD/Psychopathy/Sociopathy/other such psycho-pathologies" are ABSENT. This reflects on another value, the Pseudo-R-squared value, touched upon later.

The multivariate analysis is done, here, counting only the 5 factors that have a p-value less than 0.05 in the bivariate analysis. Hence, Age (.79) and Educational status (.68) are not inserted. We're left with a 5 variables function that iterates in a matrix of these values and maximizes the probability of observing the real distribution of the 1482 participants.

The algorithm calculates the beta coefficients of the variables and the aOR (adjusted Odds Ratio) is the exponential of the beta value (here, 3.78 for "Consumes DFSA porn".

Once again, consult the 95% CI: (1.72-8.28). There is no predictive capacity in this. It's either a mild increase, or a social plague catastrophe. The result is that "yeah, it's anywhere between 1.72 and 8.28" which is basically like saying "yeah there is anywhere between a 0 and a 100% chance of this happening" (exaggerated, but I need to get the point across of what this means in simple terms).

If you look at the row above, you see that the 95% CI has 1 in it. It means that there is absolutely no correlation (in this model) between watching porn of the non-DFSA kind and committing DFSA, something that was already visible in the bivariate.
Frequency of pornography is also irrelevant as pointed out by the researchers themselves.


What can also be seen is the stat on males, non-heterosexuals and immigrants.


So we have an utterly useless model for the purpose of the study (determining a correlative link between consumption of DFSA porn and perpetrating DFSA), with the results being "yeah anywhere between mild increase and full-blown apocalypse".

The p-value doesn't mean shit when it comes to these aORs and CIs, it merely means that "yes, actually, this model is this faulty".

And the ultimate proof is the McFadden Pseudo-R^2 being so abysmally low (0.123).
The McFadden Pseudo-R^2 is a type of check that is done to see if the model fits the data. Basically through it you can check the amount of variance, or "how much of the phenomenon is actually explained by the model". Here, a measly 12.3% of the phenomenon of DFSA is explained by the multivariate analysis, which just means this model is USELESS AS FUCK, because it leaves an 87.7% unaccounted (GEE I WONDER WHAT WOULD'VE HAPPENED HAD IT INTEGRATED OTHER VARIABLES HMMMMMMGE).

The chi^2 is useless as fuck here.

The first test is a Likelihood Ratio Test: "What's the probability that the likelihood of this multivariate (in this case, 8-variate) model is less than the likelihood of a 0-variate model (which is the null model)?". It being 88.8 with p<0.001 is due to the sample size of 1482, infinitely bigger than the 47 people that consume and perpetrate DFSA. This because chi^2 = 2*(ln(L_M)-ln(L_0)) where

L_M = likelihood of the model
L_0 = likelihood of the model without predictors (the variables)

now, ln(L) = sum from i=0 to i=N of ln(p_i) where N is the sample size, p_i is the probability of the event (in this case, perpetrating and consuming DFSA) calculated on each participant.

this means that the chi^2 value is directly proportional to the sample size. Its value of 88.8 is solely due to the sample size of 1482 obfuscating the irrelevancy of the model.

Why is the pseudo-R^2 this low, then? Because:

R^2 (of McFadden) = 1 - ln(L_M)/ln(L_0)

Applying the chi^2 formula here:

R^2 = -chi^2/2*ln(L_0)

What happens here is that even if the chi^2 value is apparently good, the denominator grows in a way that is directly proportional to N, the sample size.

Let's apply it to this study:

We need to find ln(L_0):

we know that ln(L_M)-ln(L_0)=88.8/2=44.4

we also know that 0.123 = 1 - ln(L_M)/ln(L_0) = [ln(L_0) - ln(L_M)]/ln(L_0) = -44.4/ln(L_0) so we find that ln(L_0) = -44.4/0.123 = -361 (approx)

which is coherent with the fact that L_0 is between 0 and 1 and logarithms of values between 0 and 1 are negative.

With this, we find that the L_M is -316.6 approx -317.

now, -chi^2 = R^2 * 2*ln(L_0) = 0.123 * -722 = -88.8 so that chi^2 = 88.8 as we have.

So?


So chi^2 is no parameter for judging the predictive ability of anything. It is merely a sign that "there is something in the data, and it's not due to white noise" the REAL parameter by which to judge predictive ability is the R^2, which is pathetic (0.123).


I need you to understand intuitively what is happening in this statistical hell.


There are 1482 people that constitute the sample. 100 of these perpetrate. 1382 of these don't. This is the base model without predictors, the null model. The equation that represents it would be log(p/1-p)=beta_0. beta_0 is a constant in the null model, also called "intercept".

The probability to extract a perpetrator out of the 1482 is 100/1482=0.067476;
The probability to extract a non-perp is 1382/1482=1-0.067476=0.932524.

Recall the earlier formula for ln(L). Here, there is a flat sum of 100*ln(0.067476) + 1382*ln(0.932524) = -366 (close enough to -361, approx errors and shit).

Then let's consider the 8-variate model. It assigns different probabilities to different cells in a matrix which represent intersectionality of variables. The likelihood is bound to be higher than that of the base model because of this, it is assigning "more correct" probabilities to different outcomes. The equation for this model would be log(p/1-p) = beta_0+beta_1X_1+...+beta_8X_8 (8 variables X_1 thru X_8 and 8 beta coefficients)

However, the summation is always done on the whole sample. This means that a low initial sample can have a chi^2 value below the minimum acceptance value (about 15.5 for 8-varied models) and signal that the model is shit as fuck, but a high initial sample with the same data of perps will pump up the model to high chi^2 values, however the R^2 will still be abysmally low to signal that the model is not explaining shit.

Recall the chi^2 formula: chi^2 = 2*(ln(L_M)-ln(L_0))

This is just two times the distance between ln(L_0) and ln(L_M), which is the difference in likelihood between the base and 8-variate model. What's happening? The 8vmodel (again, JFL if it wasn't) has a likelihood, ln(L_M), closer to 0 than the base model. This means the 8vmodel is getting rid of some chaos and providing explanation for some percentage of the phenomena.

The chi^2 formula has a minimum acceptance value, which for 8vmodels is about 15.5. What the chi^2 measures is simply if and by how much the proposed 8vmodel is "picking up explanations of phenomena".

The true measure of the predictive ability of the model is the R^2 though. By dividing the -chi^2 by the 2*ln(L_0) the R^2 is effectively measuring the percentage of "chaos" that is being "explained" by the model, essentially dividing the movement distance by the initial value. (In this case, a whopping 12.3% of it geg). It is always a number between 0 and 1 due to this.


The second test is the Goodness of Fit test of Hosmer-Lemeshow. It divides the sample in risk deciles and confronts the frequencies of "Yes" and "No" observed in the sample with those provided by the model. "Does my model fit the data well?". The higher the p value here, the better, because you're checking the truth value of the null Hypothesis (that the model fits the data perfectly) so it has to be closer to 1 than to 0. The problem is that with 47 people who consume and perpetrate DFSA, the sample is too scarce locally to be able to reasonably pick up the distortion of the model. Still, the p-value isn't even that high (p=.48 is basically a coin toss, which I wouldn't trust to fit the data personally).

This is the equation that represents it:

View attachment 1740692
- g ranging from 1 to 10 is the division in risk deciles, 1 being lowest risk and 10 being highest risk (as established by the 8-variate model);
- O_(1g) and E_(1g) are respectively the number of positive cases (in this case, perps) observed and expected by the 8-variate model.
- O_(0g) and E_(0g) are respectively the number of negative cases (in this case, those that do not perp) observed and expected by the 8-variant model.

What is happening here?

The 8-variate model assesses the risk for each decile. Then, it estimates (E_1 and E_0) the amount of people that will perp and not perp (1482/10=148 (rounded down) * risk probability calculated for that decile).

Then, for both the 1 (perp) event and 0 (non-perp) event, the distance between the observed and estimated values is squared and divided by the expected value, then they are summed and this for each decile.

What's the problem here? Without enough data, the lower risk deciles return irrelevant values that are in the order of 10^-1 or even 10^-2; let's assume the risk value of the 1st quintile to be 0.5%; then 148*0.005=0.74. That is the expected value for the 1 event. The expected value for the 0 event is 148-0.74= 147.26. Let us assume that the observable reality has O_(1,1)=0 and O_(0,1)=148.

The formula returns [(0-0.74)^2/0.74]+(148-147.26)^2/147.26=0.74+0.00371859296482412060301507537688=0.74 approx.


So when there is a lack of data (for instance, 100 perps in 1482 people), of course the chi^2_(HL) will be low (has to be lower than 15.5 for this test), returning a p value great enough to pass the test.

What would happen with more data?

Let's assume the sample size is N=12422 (for no particular reason at all) with 385 perps (for no particular reason at all)
Assume there were even just a handful of perps, say, O_(1,1)=3, say the risk value was 0.5% for the first decile: E_(1,1)=1242*0.005=6.21 [THIS IS MERELY TO SHOW HOW LACK OF DATA SKEWS THE TEST]
Do this shit for yourself, it's already fucking 4:40 AM and I've been writing this for 7 hrs, anyways the result is about 1.7 which is 2.5 times the original value. Very likely the chi^2_(HL) value will be higher than 15.5, completely fucking up the test. I'm tired. I wrote this after the below considerations and before the discussions section. the voices are winning ADHBAIDFHBCDFHBGA


Everything said above applies here too. With the only difference that this SHITTY fucking model accounts for... 6.6% of the variance in victimization. WHERE IS THE REMAINING 93.4%???? I already replied above as to why this is. Literally this model fails to explain why 93.4% of the DFSA happens irl.

This study is fucking bullshit. But before heading to the "Discussion" section, I want to highlight why this study should be studied in statistics courses as the most baseless, politically motivated, biased piece of shit ever seen ever.

50% PREVALENCE HAHAHAHAHAHAHAHAHAHAH


This was calculated using a formula that returns the minimum number of participants a study has to have to be valid, Cochran's Formula:
N=[Z^2*p*(1-p)]/E^2 where:

Z = 1.96 for 95% confidence;
p = Prevalence (here 0.5)
E = margin of error (here 0.025)

Plug the numbers in. The result? 1536.6 so 1537.

What's the problem here?


They used the prevalence value that would net them the least amount of participants to involve in the study (p*(1-p) has its maximum at p=0.5, assuming 0<p<1, extremes included)

However, assuming a prevalence of 50% for a literal fucking crime goes against basic principles of statistics regression. The standard is to assume a prevalence of 3% and a relative error margin of 10%

the corrected formula would be
N=[Z^2(1-p)]/((E^2)*p) where:
Z=1.96 for 95% confidence:
p= Prevalence (new: 0.03)
E = margin of RELATIVE error (new: 0.10)

The result? 12421.16 which is 12422.

TWELVE THOUSAND FOUR HUNDRER AND TWENTY FUCKING TWO PARTICIPANTS.

Why does this matter at all?

The Confidence Interval used in this study is calculated on Odds Ratios, so the extremes are not linear, but exponential.

the confidence interval is of the form [e^(beta-1.96*SE), e^(beta+1.96*SE] (1.96 is the Z parameter of 95% Confidence from before)
And the SE is approximated by the function 1/sqrt(x) (not in multivariates, the SE is higher due to the multivariate nature)

This means that the more data in the cell "Consumes DFSA porn and perpetrates DFSA", the less the value of the SE, and thus the less the amplitude of the interval, meaning the precision is higher.

These fucking retards, though, only had 47 data points. This effectively made the extremes of the CI explode and all the precision was lost.

With 12422 participants, though, assuming a found prevalence of 3.1% (WHICH IS CORROBORATED EVEN BY THIS SHIT FUCKING STUDY BECAUSE 47/1482 = 0.0317 AAAAAAAAAAAAAAAAAAAAAAAAAAAAAAAA THE VOICES THE VOICES AAAAAAAAAAAAAAAAAAAAAAA THEY'RE WINNING AAAAAAAAAAAAAAAA) there would have been 385 data points, and the SE would've been wayyyy lower.


In fact, let us calculate the SE with n=47.

SE = [ln(superior extreme of the CI)-ln(inferior extreme of the CI)]/(2*.1.96)=a bunch of numbers=0.4009 approx 0.4010.

This is coherent with a "Consumes DFSA porn" beta value that is ln(aOR)=ln(3.78)=1.32972400 approx 1.330.
Check = [e^(1.33-1.96*0.401),e^(1.33+1.96*0.401)]=[1.723, 8.2975] approx [1.72, 8.3] which IS EXACTLY WHAT THE RESEARCHERS FOUND.


As I said, this is incredibly irrelevant to any predictive capacity: "Hey I measured my temperature and the thermometer said my temp is anywhere between 35°C and 42°C!!!!". Worthless.

Let us assume the same conditions (3.1% prevalence, 95% Confidence, 10% Relative Error Margin, 3.78 aOR, 1.330 Beta Value, but n=385 perpetrators that consume DFSA porn (3.1% of 12422)) and let's run the calculations to see the new CI.

New SE = 0.401*sqrt(47/385)=0.1401.
New CI = MATH MATH MATH = [2.87 - 4.97]

way, WAYYYY more precise. BUT.

This cannot realistically happen. This is assuming too many things:
1) "Linearly-Geometrically" Diminishing SE value. In reality, with a sample nearly 8 times larger, the covariance would likely completely alter the values, the aOR would not still be 3.87, the beta value would change, and thus the CI.
2) Introducing the "forgotten variables" (mentioned like 5-6 times already) would introduce causes that are empirically much, much more relevant than these ones (as one could assume by the 0.123 McFadden value JFL, 87.7% of the cases of DFSA cannot be explained by this model JFL JFL JFL)
3) Having the sample reflect accurately real life demographics would likely increase other covariances' relevancy, further diminishing the aOR of "Consumes DFSA", and I think [PERSONAL OPINION] the CI's inferior extreme could even be veeeeeeeeery close to 1, from above.


So, what do we actually know?

1) This model is worthless.
2) Any conclusions one can draw from this model are inappropriate as a result.
3) Psychiatry is not a science and social sciences are not scientific at all.
4) Torture data, and they will tell you any story you want to know, or something.
Discussion Section

Holy JFL.

proved to be faulty as fuck and likely irrelevant when compared to the "forgotten variables"


so? this was not the point of the study at all.

DFSA pornography isn't necessarily more violent than any other type. I don't want to dismantle each of the studies, let's suppose they are reliable. Then what? How does this data tie into your study? You have "proven" that there is no precision in the data and no conclusion can be drawn off of your faulty fucking model. Good job. Again, you cannot explain 87.7% of the DFSA perpetrators' variance and 93.4% of the victims' variance. Your model is incredibly useless. YOU YOURSELVES have established the statistical irrelevancy of the Confidence Interval of frequency and type of porn watched, barring DFSA and DFSA ONLY, YOU DID NOT EVEN ACCOUNT FOR "VIOLENT PORN".

Your aOR is faulty, your R^2 value is enough for me to discount your shit.

How are these scripts perceived as normative or acceptable and how do they explain the 87.7% and 93.4% that you couldn't account for?

KEK FUCKING MAO at the politicized double standards.
"Men? Duh, of course they are here".
"Faggots, troons and niggers? WOAH WOAH WOAH, there are 69 googolplexes relevant factors like COUNTRY OF ORIGIN and the HETEROGENEOUS NATURE of those groups (because everyone knows men are one entity silly, take your lithium it's time for your (((meds)))). Let's not get ahead of ourselves here. 10 million more euros in bullshit research to produce worthless papers are needed."

ARE YOU FUCKING SERIOUS RIGHT NOW??????? YOU'RE JUST GOING TO GLOSS OVER ALCOHOL AND DRUGS????????????????????????????????????????????? WHEN YOU CAN'T EXPLAIN 93.4% OF THE VICTIMIZATIONS??????????????????????????????????????????????????????????????????????????????????? CAN YOU FUCKING STOP LOOKING AWAY FROM REALITY FOR A SECOND???

WHAT???? YOU'RE ADMITTING THE ILLICIT NATURE OF DRAWING CAUSAL HYPOTHESES, YET DOING SO ANYWAYS??????????????????????? AHAHDUSHDQJKWAD BGEQKFHG BWEIFKRJFHGBSRUIKFH BRHJKFHGDJHFHJDHGFJDHAHHAHAHHAH DUOHDIUEHFWEFH THE VOICES HAHAHAAHAHHAHAHAHHAAHAHAHAHAHAH
Laugh Laughing GIF


DUDE, YOUR FUCKING WORTHLESS MODEL literally shat out a p value greater than .05 for educational level. AND COUNTRY OF ORIGIN? YOU DIDN'T ACCOUNT FOR THAT DJQW DHBQLKIU DHGDHHDHDHDOIHD.

Do you understand this quote?
They're saying they don't give a fuck if they did a cross-study, that cannot reveal causal links. They don't give a fuck if pornography consumption is not even correlated with perpetrating DFSA. They don't give a fuck. (((They))) will "implement the necessary sexual health promotion interventions" because that was the entire goal of this bullshit paper. Provide an excuse, even a poorly crafted one, for policy. Don't believe me? Look at who funded this paper. I will tell you in a minute.

AAAAAAAAAAAAAAAA POLITICS POLITCSIS QASAAASPAJWDIòOJQAWDIOJHQWAIKDUHJDIQAUWKHDIQKAHD AAAAAAAAAAAAAAAAAA (thanks for the funding daddy UN and EU) AAAAAAAAAAAAAAAAAAAAAAAAAAAAAAAAAAAAAAAAAAAAAAAAAAAAAAAA.

provides literally no evidence.

no it DOESN'T.

I'll leave the commenting to you. It's 5 AM. 8 hrs writing this shit. wtv. more online legislation. more censorship. more power to (((them))) and women. women most affected btw.

should've made it public for ease of access and trust.

postdoc grants are fucking cancerous, NextGenerationEU is post-covid funds (5 yrs later still pumping funds OK), HOW IS THIS HELPING TO RECOVER FROM COVID ASDHJNQWOAHD NQLIAHD ILUHIUDF. Also legit funding from the "University Institute for Research in Police Sciences", but absolutely no involvement in the study (trust me bro) GEG.

I want to die so fucking bad ChatGPT and OpenAI written papers SJWIOPDJEOòFCHJWLIFUKWHFUWEHF.


Why do I think they HARKed the study?

It's not really HARK (Hypothesizing After Results are Known) but more of a conditioned study (hehe I fucking baited you HAHAHAHAHAHA):
Nobody had thought of studying this shit before; there was no internationally validated questionnaire for DFSA perpetration and porn consumption; the statistics are extremely jarring and misleading and the model is worthless; the ideological tendencies are very potent; funded by the literal "University Institute for Research in Police Sciences"; pushing for legislation and "sexual health awareness" stuff when you have a literal nothingburger; avoiding alcohol and drug consumption as covariates; shit sample that doesn't represent the Spanish population, instead represents liberal leftards university partygoers, literal fratfagboys; hastily crafted sample size likely due to high cost of finding 12422 people that could represent the spanish population decently and maintaining a study with them, applying a textbook technicality that shouldn't apply when investigating crimes; will to infer causal links from a cross-sectional study; prolly more shit I'm forgetting.


if you want, read this thread I made:

if you want, read why I think psychiatry is retarded and the DSM is stupid cultish propaganda:

I am not a social scientist, just a mathematics undergrad. Feel free to dismantle my statistics knowledge if you know more than me. Tell me directly if that is the case. this study made my eyes bleed.

FUCK I FORGOT A VERY IMPORTANT THING WHEN COMMENTING VICTIMIZATION (TABLE 4).


with a bivariate analysis p-value of .07 for the row "Type of pornography consumed", the correlation is strictly non existent. However, they ran a multivariate analysis regardless, and even later hypothesized about possible causative links between consumption and victimization. IN A CROSS-SECTIONAL STUDY. WITH A P-VALUE OF .07 (anything greater than .05 implies no correlation). ARGHHHHHHHHHHHHHHHHHHHHHHHHHHHH.

now that I look at it, they ran multivariates in Table 3 and Table 4 with VARIABLES THAT HAD A P-VALUE GREATER THAN .05 TOO AHAHAHHAHAHAHA.
 

Users who are viewing this thread

shape1
shape2
shape3
shape4
shape5
shape6
Back
Top