jagged0
Banned
-
- Joined
- Nov 12, 2017
- Posts
- 2,847
My dad is tall and has really handsome facial features, instead I got all of my mom's features pisses me off how my brother who's gay by the way inherits looks that people would kill for.
oblivioncel said:my sister worked as a model for a little more than an year while i kept being a fat sack of shit rotting in my room
jagged0 said:I don't know how you didn't just take the rope and end it.

[UWSL]By adding up the effect sizes of the highlighted variants we calculated your polygenic score for systemizing to be 2.30. To determine whether your score is high or low, we compared it to the scores of 5,000 other Nebula Genomics users. We found that your polygenic score for systemizing is in the 96th percentile. This means that it is higher than the polygenic scores 96% of people. We consider this to be a very high genetic predisposition to systemizing.[/UWSL] However, please note that genetic predispositions do not account for important non-genetic factors like lifestyle. Furthermore, the genetics of most traits has not been fully understood yet and many associations between traits and genetic variants remain unknown. For additional explanations, click on the column titles in the table below and visit our Nebula Library tutorial.
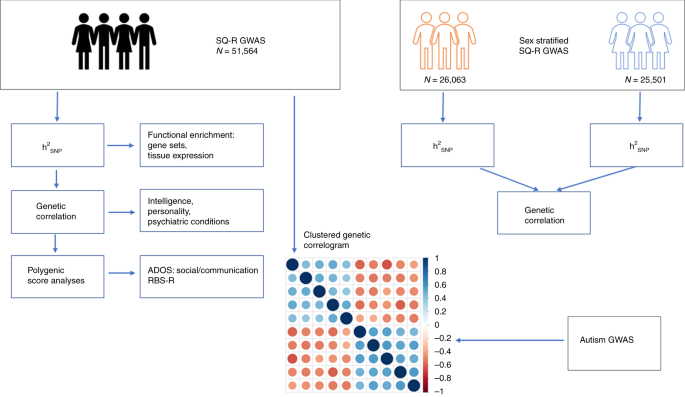
The hypersystemizing theory of autism suggests that autistic individuals, on average, have superior attention to detail, and a stronger drive to systemize. Systemizing involves identifying input-operation-output relationships. Here, we report the results of genome-wide association studies (GWAS) of systemizing measured using the Systemizing Quotient - Revised in n = 51,564 individuals.

These initial clinical observations have been quantified using different measures. For example, on a self-report measure of systemizing (the Systemizing Quotient – Revised, or the SQ-R)4, autistic adults, on average, score significantly higher than non-autistic individuals4,5. The same pattern of results is seen in autistic children, using the parent-report version of the SQ6. Systemizing is also highly correlated with aptitude in science, technology, engineering, and mathematics (STEM)7. Fathers and grandfathers of children with autism are significantly overrepresented in the field of engineering8. The same is true of mothers9. This is in line with higher rates of autism in geographical regions that have higher rates of people working in fields such as information technology, like Eindhoven in the Netherlands10. Further, autistic individuals are more likely to enrol in STEM majors (34.31%) compared to the general population (22.8%) and other learning disabilities (18.6%)11. STEM professionals also score significantly higher on measures of autistic traits (mean = 21.92, SD = 8.92) compared non-STEM professionals (mean = 18.92, SD = 8.48)12. Finally, unpublished work from Sweden suggests that high technical IQ in fathers increases risk for autism in children. A few studies have also investigated systemizing in other psychiatric traits and conditions, including schizotypy13 and anorexia nervosa14.
Population Group Sample Size Ref Allele Alt Allele
Population Group Sample Size Ref Allele Alt Allele Total Global 214716 G=0.770222 A=0.229778 European Sub 187686 G=0.776286 A=0.223714 African Sub 7752 G=0.9547 A=0.0453 African Others Sub 276 G=0.993 A=0.007 African American Sub 7476 G=0.9533 A=0.0467 Asian Sub 796 G=0.347 A=0.653 East Asian Sub 618 G=0.307 A=0.693 Other Asian Sub 178 G=0.483 A=0.517
Here we report a meta-analysis for intelligence of 78,308 individuals. We identify 336 single nucleotide polymorphisms (SNPs) (METAL P<5×10⁻⁸) in 18 genomic loci, of which 15 are novel. Roughly half are located inside a gene, implicating 22 genes, of which 11 are novel findings. Gene-based analyses identified an additional 30 genes (MAGMA P<2.73×10⁻⁶), of which all but one have not been implicated previously.

| Population | Group | Sample Size | Ref Allele | Alt Allele |
|---|
| Population | Group | Sample Size | Ref Allele | Alt Allele |
|---|---|---|---|---|
| Total | Global | 7920 | G=0.3301 | A=0.0000, C=0.6699, T=0.0000 |
| European | Sub | 7116 | G=0.2919 | A=0.0000, C=0.7081, T=0.0000 |
| African | Sub | 510 | G=0.820 | A=0.000, C=0.180, T=0.000 |
| African Others | Sub | 22 | G=0.77 | A=0.00, C=0.23, T=0.00 |
| African American | Sub | 488 | G=0.822 | A=0.000, C=0.178, T=0.000 |
| Asian | Sub | 4 | G=0.0 | A=0.0, C=1.0, T=0.0 |
| East Asian | Sub | 2 | G=0.0 | A=0.0, C=1.0, T=0.0 |


