VincentVanCope
M̶e̶n̶t̶a̶l̶c̶e̶l̶ Mentally ill Truecel
★★★★
- Joined
- Nov 8, 2017
- Posts
- 3,284
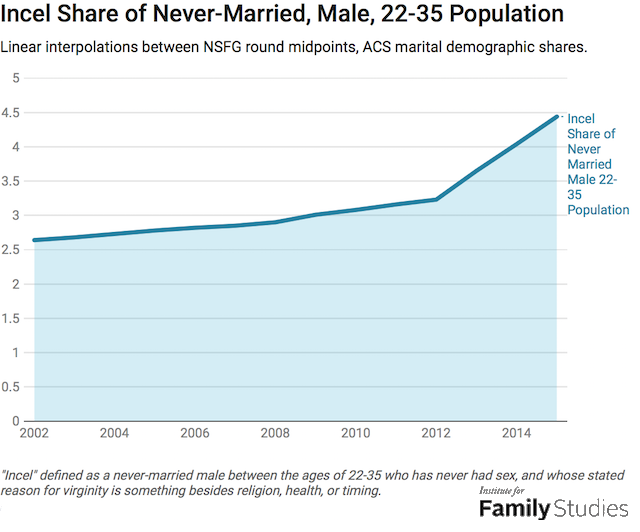
So I recently found a giga-blackpill article which had this:

Interestingly the author didn't post an equivalent graph for women. I tried going to the source and forming one myself but only americans are allowed to use the tools.
Somebody from the US please please please do the following:
Click this:
 gssdataexplorer.norc.org
Add these variables by clicking "Search GSS variables":
gssdataexplorer.norc.org
Add these variables by clicking "Search GSS variables":
-Age of respondent
-No. of male sex partners
-Sex of respondent
Then click the orange button in the top right and click "save to project". You should now be able to play with the data shown on a graph to produce a female virginity graph for ages 18-30.
Interestingly the author didn't post an equivalent graph for women. I tried going to the source and forming one myself but only americans are allowed to use the tools.
Somebody from the US please please please do the following:
Click this:
GSS Data Explorer | NORC at the University of Chicago
Web site created using create-react-app
gssdataexplorer.norc.org
-Age of respondent
-No. of male sex partners
-Sex of respondent
Then click the orange button in the top right and click "save to project". You should now be able to play with the data shown on a graph to produce a female virginity graph for ages 18-30.
Last edited: